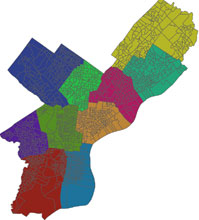
Making sense of Philadelphia’s City Council district map resulting from the 2000 Census is a head-scratching exercise. District 5 is shaped like an armored bulldozer extending its blade to scoop up a piece of District 7. District 10 looks like a lizard, twisting around the Northeast and taking a bite out of District 6. And District 7 doesn’t appear to be a district at all, but four or five strung together like beads.
“Many people consider these districts some of the worst in the country,” says Steven O. Kimbrough, Wharton professor of operations and information management, who recently participated in a nationwide contest sponsored by Philadelphia geospatial software firm Azavea to draw a better map of the city’s districts. One of the issues involved in redistricting is gerrymandering, the practice of drawing district boundaries for political advantage. This makes gerrymandering hard to define precisely: Is it removing the house of a potential opponent from the definition of a district? Is it adding a neighborhood of politically generous campaign contributors to a particular district? Is it gerrymandering to concentrate members of a single ethic group into one district or, conversely, to split them up among many districts?
As Frederic H. Murphy, Kimbrough’s fellow team member and a professor of marketing and supply chain management at Temple University’s Fox School of Business, testified during the contest, “gerrymandering is like pornography; you recognize it when you see it.” A good assumption, and one widely accepted, is that districts should be as compact as possible. They should look more like turtles than snakes (or salamanders); their parts should all be close together, rather than far apart.
Even with the best of intentions, districting problems can be difficult to solve because they are so complex, says Kimbrough, who specializes in computational intelligence. The key to finding the best solution, he suggests, is to start with not one but many good solutions, and let decision makers tweak plans from there. This may sound like common sense, but finding a pool of good solutions is easier said than done with mapping and zoning problems because of the number of variables involved. “It’s never been possible to generate multiple good solutions,” Kimbrough notes. “The standard methods at best give you a very small number of plans.”
Now Kimbrough and a team of researchers say they have found a way to generate multiple high-quality solutions to complex problems. Using a genetic algorithm that mimics evolution and natural selection, they essentially “breed” solutions, creating potentially endless variations from just a few good beginnings. Their method holds implications not just for the drawing of political boundaries, but for a myriad of zoning dilemmas in the business and public sectors — from mapping out fire districts and streamlining sales regions to discovering a better way to collect trash and design distribution systems.
“The genetic evolutionary approach can find attractive solutions that you are never going to find otherwise,” Kimbrough says.
Kimbrough and Murphy teamed up with Nicholas Quintus, a graduate of Temple University’s geography and urban studies department, and Ram Gopalan, a professor in the business school at Rutgers Camden, to test their methods in Philadelphia’s mapping contest. Dubbed “Team Fred” after Murphy, who assembled the group, they used several different methods to find good solutions to the districting problem (see Team Fred’s approach to the redistricting project here).
One of these methods involved starting with a computer-produced good solution and modifying it by hand, based on trial-and-error and human judgment, in search of the most compact solution, according to the rules of the contest. Another of these methods involved starting with computer-produced good solutions and modifying them by another computer program using a genetic algorithm in search of many — “a plurality” of — good solutions. Remarkably, this automated approach discovered 116 legally valid, high quality solutions, none of which broke up any of the existing 66 wards in the city.
Team Fred, like all other teams, was only allowed to submit one plan to the contest. It submitted the manually produced plan, which won in the category of most compact. That sufficed for a win in the contest, but the team notes that many of the 116 plans discovered by the computer are fundamentally better approaches, because they are better at honoring existing neighborhoods.
The best-drawn political districts should satisfy three main criteria, Kimbrough states: Their populations should be about equal; they should be contiguous, meaning they are not split into pieces; and they should be compact. However, political districts also must take into account many ambiguous elements, such as neighborhood identities or natural boundary lines. As a result, districting problems are difficult to solve using mathematical models alone.
“In the end, there are a lot of human judgments that go on here,” notes Murphy. “What really is that neighborhood? Can you split the wards?…. Generating one solution is not a good idea because there are all these side issues that you can’t represent mathematically. This always happens, whether in political districting or in commercial applications.”
A Philadelphia resident, Murphy became interested in the city’s districting problem after watching the bitter political infighting in 2001 that led to “one of the most gerrymandered political layouts possible.” Knowing that the districts would be redrawn after the 2010 Census, he hoped to find a way to harness modern technology to offer a better solution. “I said, ‘Well, the computing power is 100 times more powerful [than before]. Let me see if I can do Philadelphia.'”
But using classic computer models meant deriving one solution at a time. “The computer spits out a solution, and you take it or leave it,” Murphy says. “You generate other solutions by putting in other assumptions, but it’s a process that doesn’t fully inform you of everything that’s nearby as a potential solution.”
A ‘Family Tree’ of Approaches
That’s where Kimbrough’s genetic algorithm came in. Using classic computations, the team created three maps that met a minimum standard of criteria. Kimbrough then used those solutions as “parents” and bred 50 more solutions. Each of those 50 was mutated to have six “children.” Kimbrough sorted the results, making the top 50 solutions the “parents” of the next generation. This was repeated for 2,000 generations, and the entire process was repeated several times. “There are about 100 billion possible solutions. Most are pure junk,” Kimbrough notes. “The genetic algorithm examined much less than 1% of these 100 billion solutions, but it did so intelligently. Most of the solutions it examined are also junk.” But scattered throughout the “family trees” were occasional winners. Kimbrough set aside the best of the best — less than 1/100th of one percent — to search for the final cut.
Quintus then played a pivotal role — turning the strings of numbers into maps using geographic mapping software. Although all the solutions selected by the genetic algorithm met the minimum criteria, not all made sense from a local perspective. Some maps split natural communities or disregarded historical neighborhood identities. “I was looking at every map with my urban studies background and my Philadelphia knowledge,” Quintus says. The best maps included “a community of interest aspect to it — the idea that you’re either preserving some true neighborhood boundaries or you’re preserving ethnic concentrations, [reflecting] how people identify themselves as a community within the city.”
Team Fred’s approach could be used for any type of business problem requiring mapping or zoning, according to Kimbrough: It could help cities draw better districts for emergency services such as fire or police. Adding criteria, such as travel time from one side of a district to another, for example, could help a delivery company reorganize to save on gas costs. Trash haulers could find more efficient routes; sales teams could map out better territories. Better police precincts and service districts for other emergency services could be constructed, as could better sales and distribution areas. Travel costs and times can be reduced, benefiting everyone. It would help “any time you have spatialization and you’re trying to figure out where to put what.”
The two-step approach of starting with multiple high-quality solutions and then narrowing down also puts control back in the hands of decision makers. “This applies perfectly well to business decisions, this philosophy of using computing and mathematical modeling to get a good set of things, recognizing that you don’t have everything in there. Then you do the horse trading,” Kimbrough says.
That’s the beauty of this method, Team Fred suggests: By starting with a large number of high-quality solutions that meet basic criteria, decision makers have a better chance of negotiating some of the finer details that make a difference. “You need the computer because there’s so much complexity,” Murphy states, but “it’s the interaction and the learning from each other that’s the critical element.”
In today’s tech-focused business world, putting human decision makers back in the picture could be the biggest innovation of all. “Quite often in business situations, people are too trusting of the numbers,” says Murphy. Team Fred’s methodology “involves sophisticated computing, but a process that keeps the human involvement central to coming up with the final solution.”