In August, the current bull market in U.S. stocks became the longest one in history — and there are scant signs of it slowing down. The Dow, S&P 500 and Nasdaq have recently set all-time highs despite uncertainty over the trade war with China and political turmoil in the White House. For investors and other market participants, the big question is this: Is the stock market overvalued and a bear market is long overdue, or are stocks still reasonably priced and more upside is yet to come?
To answer that question, Wharton finance professor Jeremy Siegel and Yale University economics professor Robert Shiller made their cases at the recent conference, “Financial Markets, Volatility and Crises: A Decade Later,” held in New York by Wharton’s Jacobs Levy Equity Management Center for Quantitative Financial Research. Siegel is often seen as a perennial bull and Shiller is viewed as ever the bear. The two, who have been friends since the late 1960s, often give opposing market outlook views separately on business television. It is rare for them to spar in person.
Siegel and Shiller met while graduate students at MIT. “I met Jeremy standing in line for a chest X-ray. They sent us in alphabetical order — Shiller and Siegel,” said Shiller, who is a Nobel laureate and creator of the widely followed CAPE (Cyclically Adjusted Price-to-Earnings) Ratio, also known as the Shiller PE Ratio. “Our books tend to be adjacent to each other in book stores.” What he learned from Siegel was that “it’s possible to view economics as really connected to the real world.”
Shiller pointed out that despite how Wall Street and news outlets typically characterize them, it is not true that Siegel is always bullish and that Shiller is perpetually bearish. “In 2000, we were both bears,” he said. Siegel agreed: “Certainly, we’ve had our disagreements on outlook, but as you said we were both very bearish at the top of the dotcom bubble in 2000.” Siegel is the author of the classic Stocks for the Long Run, often described as one of the best investment books of all time.
Siegel’s Bull Case
Siegel said that since the early 1800s, stocks have brought in a total return after inflation of 6.7% on average annually, far outpacing other asset classes. Bonds came in at 3.5% in terms of historical total real return, Treasury bills at 2.6% and gold at 0.5%, while the dollar has actually depreciated by -1.4% on average yearly. That means $1 invested in stocks over that time would have turned into $1.4 million while the same dollar in bonds would have become $1,599 and T-bills would have been worth $263. Gold clocks in at $3.09. Holding on to that $1 means its value would have fallen to 4.8 cents.
“In recessions, you get big writedowns.” –Jeremy Siegel
Siegel then examined the stock market’s valuation over time. From 1954 to 2018, the median price-to-earnings or PE ratio (a popular metric in valuing stocks) is 17. There was a dip in PE in the 1970s and 1980s, when double-digit interest rates brought the stock market down. The lowest point was in March 1980, when the PE hit 7.15. The high over this period was in June 1999, when the PE hit 30 during the peak of the dotcom bubble.
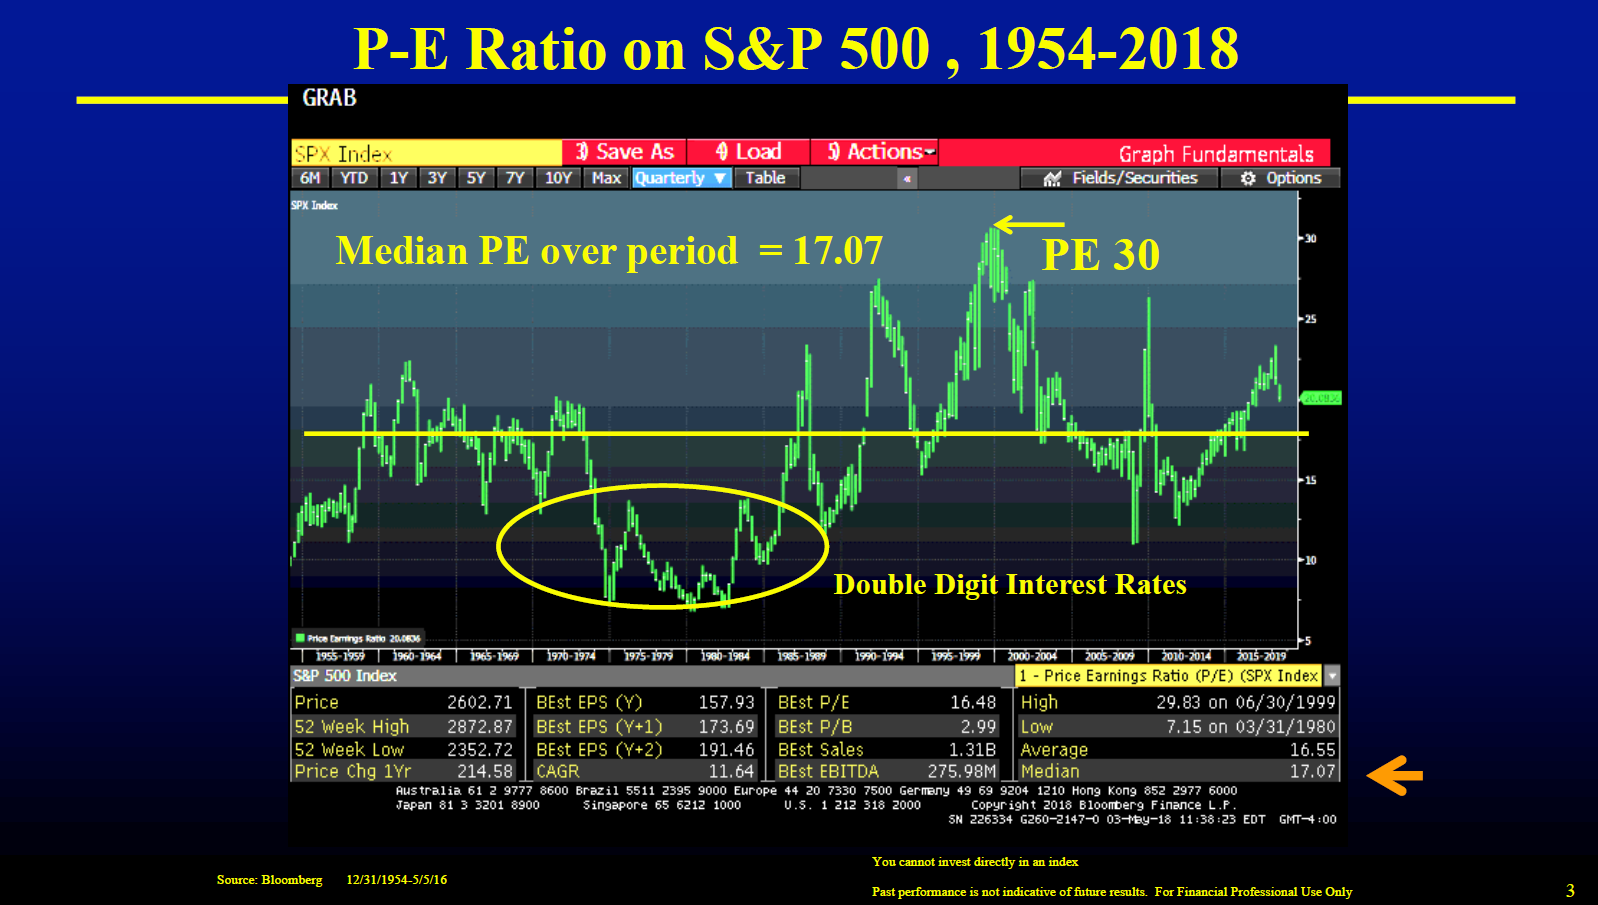
Where are we today? “You can see we’re not that high” based on the last 12 months of earnings. Siegel said. “We’re actually just in the low 20s there.” When calculated using this year’s earnings estimate, the PE drops to 18, and further dips to 16 when using 2019 estimated profits, based on the type of earnings he uses. (Siegel prefers to use S&P operating earnings to get his PE ratio.) This calculation includes such things as stock options expenses, pension value changes and others. Siegel doesn’t use the other two types of earnings calculations: firm reported earnings and GAAP (Generally Accepted Accounting Principles).
Firm reported earnings “are the most liberal,” Siegel said, meaning it makes the company’s performance look its best by excluding many things from the profit calculation such as severance costs, litigation expenses and others. GAAP can be misleading. In the 1990s, GAAP went to mark-to-market. “It mandates writedowns and asset impairments whether the asset is sold or not,” he said. “That never used to happen.” And on the flip side, “it doesn’t permit you to write up the asset unless you sell it and prove that there’s actually value — so it’s almost a one-way buy,” Siegel added. “In recessions, you get big writedowns.” He noted that billionaire Warren Buffett, chairman of Berkshire Hathaway, called GAAP’s mark-to-market rules “useless” when used to analyze the ongoing valuation of a company.
Siegel said that over the last 140 years, the long-term PE ratio averaged around 15, which corresponds to a 6.7% earnings yield, or real return on stocks. He said a PE ratio of 18 forecasts a real return of 5.5% for stocks — 2% dividend, 3.5% real earnings per share (EPS) growth, with 2.5% due to stock buybacks and 1% organic growth. Nominal return is 7.5% including 2% inflation.
This 5.5% return forecast is more than 4.5 percentage points over the 10-year Treasury note, which is the equity risk premium. (The risk premium is the extra return stocks have to bring to make them worth holding since they are more risky than government Treasuries.) This premium historically averaged 3 to 3.5 percentage points. The upshot is that “stocks are overvalued on a long-term basis, but bonds are enormously overvalued on a long-term basis,” Siegel said. “The relative valuation of stocks relative to bonds is actually among the … more favorable in history.”
According to Siegel, the reason why Shiller’s CAPE ratio is more pessimistic is that it assumes there will be reversion to the norm — meaning the market goes high and low but usually reverts to its historical trend. But he questioned this assumption. “Should we go back to 15 as the long-run normal, or CAPE at 16.5 [median return] or so? My feeling is, ‘no, we shouldn’t.’ I say that the warranted PE ratio is higher than history. And one of the reasons for that is indexing at zero cost, which was totally unavailable during the greatest part of this [market] sample.”
Siegel said for much of the stock market’s history, the average investor had to pay higher brokerage costs, bigger bid-ask spreads, etc. “I don’t think it’s unreasonable to assume 1%, 1.5% per year [in transaction costs] back then to do it. Now it’s zero” with ETFs and the like, he noted. “What does this mean? Will you really get 6.7% in the 19th and early 20th century? No. At best, you’re probably getting 5% real … [which] actually corresponds to a 20 PE ratio; 5.5% real would correspond to 18.”
“The market is filled with real people, and they have their own stories they’re telling and ideas that change from time to time. So, should we think like [it’s] 1916 or not?” –Robert Shiller
Siegel continued: “So given that costs have gone to zero of maintaining a fully diversified, efficient portfolio, that in and of itself argues in my opinion for a higher equilibrium PE ratio than historical. You could almost call that a new normal of zero transaction costs. By the way, I’m not even talking about interest rates being at record lows, which could maybe inflate the ratio.” Moreover, for every one percentage point drop in dividend yield, there should be a corresponding increase in EPS growth. “That leads to a distortion in Bob’s CAPE, because Bob assumes a constant real growth if there’s going to be a lower dividend yield. Bob actually moved to a total return CAPE — which is different from the CAPE published on [his] website — that makes the correction.”
Shiller’s Bear Case
Shiller presented a chart showing the S&P composite index juxtaposed against the EPS trend line, going back to 1871 (adjusted for before the S&P was created). Siegel and I “agree that history is important. Why is history important? It’s because big movements in these ratios don’t happen very often,” he said. “You want to understand what they mean.”
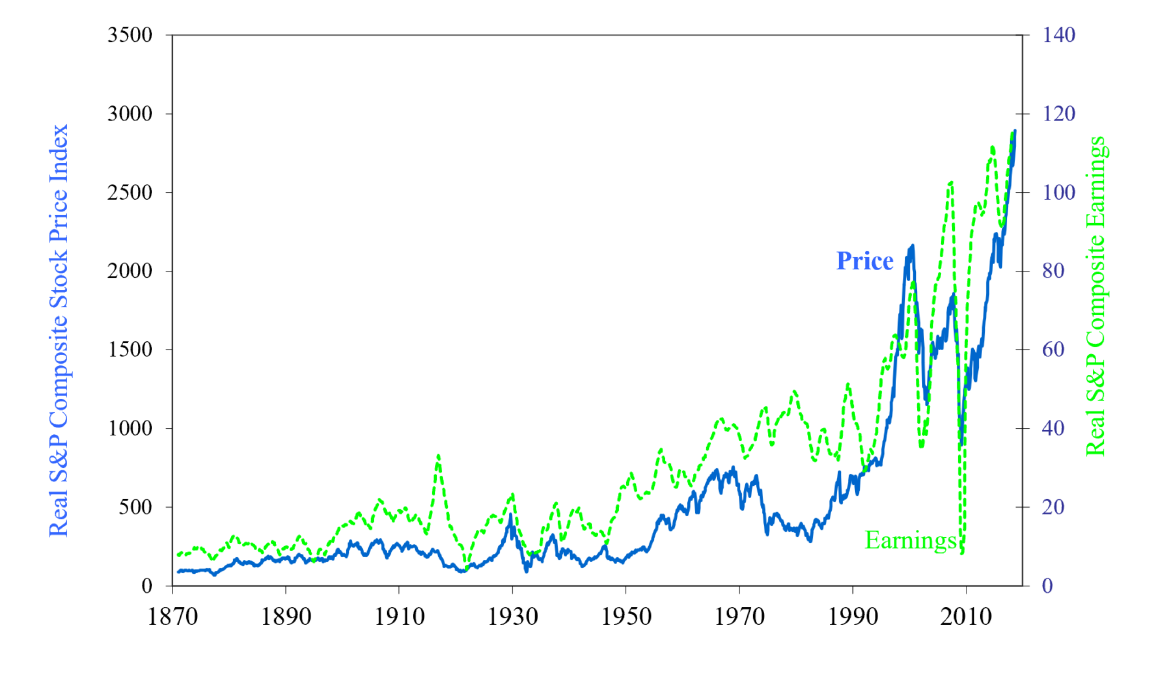
Between 1910 and 1930, there was a big jump in earnings, around the time of World War I. “That spike occurred before the U.S. ended the war. You notice the stock market didn’t go up very much. Why didn’t it? Newspapers called it the flood of earnings and they attributed it to the war. A lot of Europeans were buying munitions supplies from the United States. Why didn’t the market go up? [The earnings leap was due to] the war. It was not permanent. After the war was over, the earnings went back down,” Shiller said. “I think the market did the right thing in 1916, which is not to overreact to the sudden burst in earnings.”
Then Shiller noted that earnings jumped again between 1921 and 1929, “but this time, the market went up all the way.” The peak in 1929 was an “overreaction. They didn’t have the skepticism that they had in 1916. Why didn’t they? It was a different atmosphere. It was the roaring 1920s. They just wanted to believe it.” Of course, the Great Depression came shortly after the market crashed. Shiller gave another example. In the 1980s, earnings were going up but stocks were not. “What was the spirit of the times in the 1980s? … Double-digit inflation and really high interest rates,” he said. But then in the 1990s, both earnings and stock prices shot up. Also, leading up to the 2009 crisis, earnings were rising but stock prices didn’t go up as much. “Now, it’s doing it again,” with stocks and earnings rising in tandem, Shiller said.
“If you want to predict tomorrow’s price change, it’s very hard. But if you want to predict [what’s going to happen in] five to 10 years, you have a better chance. This is just the reverse of weather forecasting.” — Robert Shiller
“The market is filled with real people, and they have their own stories they’re telling and ideas that change from time to time,” Shiller said. “So, should we think like [it’s] 1916 or not? Is this temporary? Well, it’s kind of fuzzy. Probably the reason earnings are up is because they’ve cut corporate profits taxes, and [pro-business] Donald Trump is president. So is Donald Trump permanent? I won’t get into that.” He added that he thinks the market is overreacting again. “We’re launching a trade war,” Shiller said. “It’s likely to be a bad time for the stock market.”
Shiller said the CAPE ratio is calculated by taking the inflation adjusted index price and dividing it by the 10-year average of inflation adjusted earnings to smooth out business cycle fluctuations. It is commonly used to determine whether the stock market is overpriced or not. From 1926 to mid-2017, when the CAPE ratio hit an average low of 8.6, the stock market returned a “very high 9.8% average” annual real return for the S&P 500, he said. When the CAPE is at 33, the average return is less than 1%.
“That’s where we are now,” Shiller said, hastening to add that he’s not predicting a crash. “This is a 10-year forward return.… If you want to predict tomorrow’s price change, it’s very hard. But if you want to predict [what’s going to happen in] five to 10 years, you have a better chance. This is just the reverse of weather forecasting.” However, Shiller remains convinced that stock valuations are “just too high at the present day.” Even if one uses other metrics to substitute for earnings, such as book value, cash flow and others, he noted, the outcome is the same.
Shiller said Siegel has been a “strong critic” of CAPE because it uses firm reported earnings. Shiller did acknowledge that changes in accounting rules over time may have led to a downward bias in reported earnings resulting in an upward bias in CAPE. So Shiller and one of his colleagues replicated Siegel’s results using total return CAPE. They still forecast that “expected returns should be low for the next six to 10 years based on historical” trends.
Moreover, Shiller said Siegel’s earnings data are not squeaky clean. He pointed to a footnote in a 2016 Siegel paper disclosing that “this NIPA (National Income & Product Account) per share profit series is then spliced to the S&P 500 reported earnings series by equating the 10-year averages for 1929-1939 for both series.” For his part, Shiller said that instead of “using econometric techniques to splice two different histories together,” he and his colleague re-evaluated Siegel’s results using actual reported observations. The result is a 25% lower 10-year annualized total return.
Finally, Shiller said Siegel’s argument that modern times call for a re-evaluation of the market sounds similar to one made by economist Irving Fisher in 1930, in a book called The Stock Market Crash — And After, which was “very optimistic about the stock market…. [Fisher] said that now in modern times, investors are much more sophisticated, and they know that the stock market has … outperformed other assets over the long run. They know they can diversify their portfolios, and they even have funds that would help them do that. He predicted a brilliant future for the stock market in 1930. It was a short-run mistake.”
“The equity premium right now is high on a historical basis.” –Jeremy Siegel
Shiller believes that the spirit of the times informs the market. Back in 1929, there was a “sense of glamour or opportunity” with a big housing boom and a roaring stock market just before the economy turned south. “Right now, we have high real estate prices and high stock prices happening at the same time.” Shiller further pondered, “What is the zeitgeist today? What is the atmosphere? It’s a time in history when we not only have Donald Trump in the U.S., but we have populist leaders around the world, and they are kind of nationalist — it’s also not a friendly time.”
Tech Stock Trends
Siegel responded to Shiller’s comparing him to Fisher by pointing out that the “average cost of mutual funds in Irving Fisher’s day, even up to the 1960s and 1970s, was 2% a year. You are definitely lagging that amount [in portfolio returns]. Today, you don’t lag.” He also pointed out that economists today have a hard time explaining the risk premium. “The equity premium right now is high on a historical basis,” Siegel said. “Ten-year TIPS [Treasury Inflation-Protected Securities] are under 1%, and yet stocks are 5.5% at current valuation. That’s a big margin. Margins should be smaller.”
As for real estate prices going up, Siegel said it’s because of older investors seeking a higher investment return. “We have an aging investor class. Real rates of return are very low. Growth is low, population growth is low, [and] risk aversion is a bit higher [after] two big bear markets in the last 15 years. That’s one reason you have a higher equity risk premium. But real [interest] rates are low and likely to stay low for quite a while. That would cause real estate [prices to rise].” Siegel also pointed out that globally, U.S. real estate is considered “cheap.” Other countries have gone up much more. “I’m not saying that’s rational. I’m saying it’s not a local bubble.”
Asked how the currently hot FAANG stocks (Facebook, Apple, Amazon, Netflix, Google) would fare in the long run, Siegel compared the situation to the 1990s, when small stocks were believed to outperform in the long term. After further investigation, he found that the small stock premiums from 1929 to the 1990s were mainly due to a 9-year period — starting in 1975 — of “unbelievable outperformance.” The rest of the time, they did not.
“Here was something that was supposed to be a persistent [outperformer, but it only] showed up for less than a decade and then tended to disappear,” Siegel continued. “Is that what’s happening now? We have the FAANG outperformance. Is this a new paradigm, or is it just a streak that is going to come to an end? Now, no one knows for sure. But I did want to mention that other [stocks] have shown a lot of correlation [with FAANG] and streakiness that subsequently disappeared.”