
The wealthiest people earned their coveted places by investing in risky assets like their private businesses and then multiplying the returns, regardless of whether or not they had initial wealth from rich parents. In fact, accumulating savings from employment earnings by investing in safe assets like housing is not the best route to become of one the wealthiest. Those are the top takeaways from a new paper titled “Why Are the Wealthiest So Wealthy? A Longitudinal Empirical Investigation” by Wharton finance professor Sergio Salgado, St. Louis Fed research officer Serdar Ozkan, Penn economics professor Joachim Hubmer, and Statistics Norway researcher Elin Halvorsen.
“The main idea of the paper is to characterize the lifecycle dynamics of the richest individuals using high-quality data,” said Salgado. “We find that there are two types of super-rich: the Old Money, with parents that are rich, and the New Money, who have higher rate of returns and saving rates that bring them to the top.”
Salgado said the backdrop for their study is the debate on the causes and consequences of the concentration of wealth in the top 1%, both in the U.S. and elsewhere globally. He noted that wealth inequality in the U.S. has increased since the mid-1980s. According to Hubmer, the study is particularly relevant in the present times. “With slowing economic growth and talk of a recession, concerns about unequal distribution are becoming bigger again,” he said.
Scope of the Study
The paper’s findings are based on a study of exhaustive income and wealth data on the entire Norwegian population covering 22 years (1993-2015), which was sourced from administrative tax and income records. The study identified the shares of four types of assets that made up a typical household’s total assets: housing, safe assets (bonds, cash, and deposits), public equity (stock and mutual funds), and private equity (the value of private businesses).
The study focused on three key areas: First, it documented the evolution of average net worth over the life cycle for different wealth groups. On average, the wealthiest started their lives substantially richer than other households. For instance, the richest 0.1% group among households aged 50-54 owned on average about 120 times the average wealth ($437,000 in 2015 in Norway). The same individuals already owned 20 times the average wealth in their late 20s.
“There are two types of super-rich: the Old Money, with parents that are rich, and the New Money, who have higher rate of returns and saving rates that bring them to the top.”— Sergio Salgado
Second, it looked at households’ lifetime portfolio composition and long-term returns. It found that the current wealthiest have invested a substantially higher share of their portfolio in equity, in particular private businesses, starting from very young ages, even compared to those with the same wealth and age in the past. For instance, the share of equity for the wealthiest 0.1% households aged 50-54 was between 85% and 90% over the 22-year period covered by the study. Third, it documented the sources of income, which included initial wealth, inheritances, labor income, capital income (from safe assets, real estate, and equity), as well as taxes and transfers.
How the Wealthiest Made More Than Others
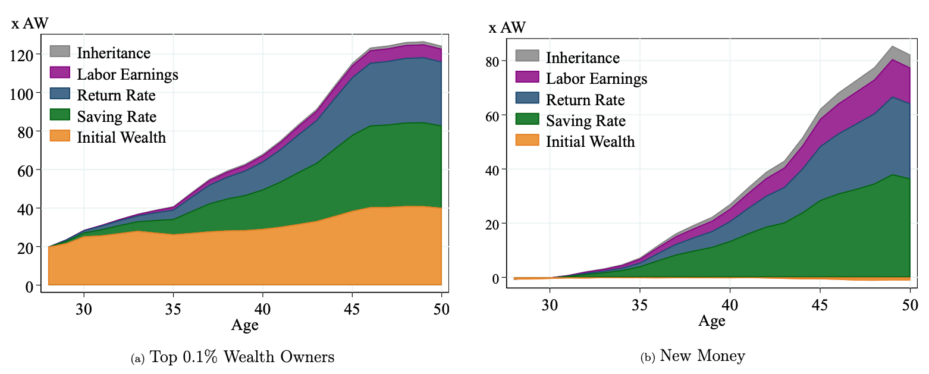
While the study tracked the wealthiest across their lifecycle, the researchers chose age 50 as a useful marker to determine how the top 0.1% made their “excess wealth,” or the degree by which their wealth exceeded that of mid-wealth households. Old Money households could trace their “excess wealth” (or how much more wealth than that of mid-wealth households) to higher saving rates (34%), higher initial wealth (32%), and higher returns (27%); the shares were much smaller for higher labor income (5%) and inheritances (1%).
New Money households, who made up a quarter of the wealthiest, worked harder to catch up: Their excess wealth at age 50 was mainly explained by higher saving rates (46%), followed by higher returns (34%) and higher labor income (16%). Irrespective of whether one started out with initial wealth or labor income, “what is important is your ability to take that money and reinvest it in a firm that is productive, obtain returns, and capitalize that income,” said Salgado.
“On average, the wealthiest start their lives substantially richer than other households in the same cohort, own mostly private equity in their portfolios, earn higher returns, derive most of their income from dividends and capital gains, and save at higher rates,” the paper stated. Notably, the saving rate progressed from 10% in the lower rungs of the wealth distribution to 70% for the top 0.1%.
Starting out rich in life is no guarantee for making it to the wealthiest circles; indeed, a few of these individuals ended up at the bottom of the wealth distribution over time, the study showed. “It’s a combination of the initial wealth they were given from their parents or other sources, and their talent as entrepreneurs,” Hubmer said. “If they didn’t have the initial resources, it wouldn’t matter how good they were as entrepreneurs. [Conversely], if they weren’t good as entrepreneurs, it wouldn’t matter how much money they had initially.”
Striking Differences
The paper highlighted striking differences between the wealthiest households and those at the other end of the spectrum.
The wealthiest invested “a substantially higher share of their portfolio” in private businesses starting from very young ages, the paper noted. Their share of risky assets (the sum of private and public equity) in their investment portfolio stayed above 80% across all ages and increased up to 89% by age 50.
Equity income was the main source – 83% – of lifetime income for the top 0.1% in the 50-54 age group. In contrast, households in the bottom 90% of the distribution earned 80% to 90% of their lifetime income from labor services. “A very small fraction of people became rich purely through labor earnings,” Salgado said. Added Hubmer: “Labor earnings are not going to make you significantly rich; it’s just not how it works.”
Safe assets and housing had a much smaller share in those portfolios, which stayed roughly constant over the life cycle.
The super-rich also kept their leverage (or borrowings) low, and it never rose about 10% of total assets throughout their lives.
“With slowing economic growth and talk of a recession, concerns about unequal distribution are becoming bigger again.”— Joachim Hubmer
For households in the bottom half of the wealth distribution, housing was the single most important asset in their portfolios, making up around 90% of their gross wealth. Low-wealth households started their lives with much higher leverage of about 80% of total assets; they lowered their debt as they progressed in life, but it never fell below 50% of total assets.
With or Without Rich Parents
Initial wealth accounted for a little more than a sixth of the total resources for the wealthiest, but it was the single most important component. Interestingly, inheritances made up “a negligible fraction” of resources for all wealth groups. Labor income made up nearly a tenth of their lifetime resources.
A little more than a quarter of those in the Old Money group had parents in the top 1% of their wealth distribution, compared to less than 7% for the New Money group. In fact, 75% of their parents of New Money were in the bottom 90%. “Most New Money households are indeed self-made and come from modest backgrounds,” the paper noted.
The paper also offered insights into how New Money households climbed the wealth ladder despite starting out from a low base. For instance, they started their working lives with equity accounting for less than 10% of their investment portfolio, but that grew dramatically to 90% by age 50, similar to the private equity share of the Old Money group. The New Money start highly indebted, but quickly reduce their leverage over the first 10 years.
The New Money group earned substantially higher returns across all age groups. For example, those in the 35-39 age group earned an average return on net wealth of around 15%, compared to 10% by their Old Money counterparts. The youngest in the New Money group also earned “a staggering” 40% annual average return on their equity investment, compared to 10% for the Old Money group.