
The first Industrial Revolution showed the world how much machines could accomplish. What GE calls the “Next Industrial Revolution” is now showing how much machines can accomplish when they communicate with each other. And just as steam — and later electricity — powered the first industrial revolution, Big Data is powering the second. Machine-to-machine communication (M2M) gave birth to the age of Big Data and advances in big data are expanding our sense of what the Internet of Things can accomplish in the coming years.
It’s too soon to know whether or not the promise of Big Data is being overstated. Google Trends shows that the number of news references for “Big Data” has increased ten-fold since 2011. Comparing that with the Gartner Hype Cycle suggests that the concept may be nearing its “Peak of Inflated Expectations” and will soon be sliding into a “Trough of Disillusionment” [see accompanying graph]. Still, if the Hype Cycle is an accurate forecast of the future, it seems reasonable to expect great things from Big Data once it reaches the “Plateau of Productivity.”
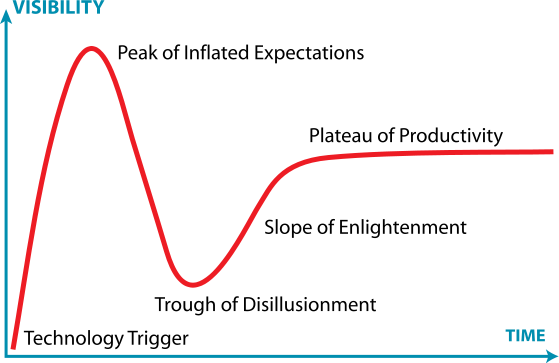
The Gartner Hype Cycle
The Four V’s of Big Data
According to Wayne Balta, vice president of corporate environmental affairs and product safety at IBM, Big Data is defined by the four V’s: volume, velocity, variety and veracity.
Volume is self-explanatory, although it doesn’t do justice to the scale of Big Data. Nothing really does. Very big numbers are commonly used to suggest the enormous quantity of data now being generated (every day, we create 2.5 quintillion bytes of data), as are comparisons with previous accumulations (90% of the data in the world today has been created in the last two years), but our minds are simply not equipped to grasp such scale. That’s why we need computers.
Velocity refers to the speed with which vast amounts of data can be ingested, integrated and analyzed for use “in real time.” Real time means virtually instantaneously. To deliver driving directions in real time, the company Inrix, for instance, gathers data about detailed traffic speeds every 800 feet across four million miles of road in 37 countries; fuses this with journalistic reports of traffic incidents, congestion alerts, maps, traffic-camera video and more; analyzes all this data, and turns the analysis into actionable directions — all quickly enough for a highway driver to use while looking for the right exit to take.
As part of the presentation he gave at the recent conference on “Sustainability in the Age of Big Data,” sponsored by Xerox and Wharton’s Initiative for Global Environmental Leadership (IGEL), Balta said that 90% of Big Data is unstructured, which means that it lacks a common format. The data includes images ranging from infrared photos to high-definition videos; recordings of bird songs and human speech; the raw feed from sensors sitting on the Martian surface and floating far out at sea, and communications of all kinds: handwritten medical records, typeset books, ancient scrolls, social media posts and emails — all contribute to the vast variety of information that has to be “ingested” and merged with structured data before it becomes useful.
No matter how much structured and unstructured data is ingested, or how quickly it is analyzed, it’s of little help if the decision makers using Big Data don’t trust the input or the output. Today, one in three business leaders don’t trust the information they presently use to make business decisions and 27% of respondents in one survey said they were unsure how much of their data was accurate. IBM calculates that “poor data quality costs the U.S. economy around $3.1 trillion a year.” Clearly, to be successful, Big Data analytics has to include a means of verifying all the varied data it uses.
One cause of concern in the Big Data community is cultural: uneasiness about sharing data. Privacy is one obvious obstacle, but so is distrust among competitors in the corporate world and even among business units within the same company. Even when the data is available, a dearth of scientists skilled in the field often prevents companies and governments from taking full advantage of all it has to offer. Paul Rogers, GE’s chief development officer, told the IGEL conference that right now, “only about one-half of 1% of the world’s data is being analyzed.” The other 99.5% falls into the category of “dark data.”
The Next Step in Big Data
Almost all computers today use the same essential approach to data crunching. Based on the work of mathematician and physicist John Van Neumann, they separate memory from processing, and work by executing pre-written, coded instructions. As computing power has grown, it sometimes seems that modern computers are doing something much more sophisticated than this. But the difference between most of today’s computers and those at work 50 years ago is modern machines do a lot more number crunching a lot faster — but they still do it in essentially the same way computers have always worked.
The first attempts to move beyond standard Van Neumann architecture focused on Artificial Intelligence (AI), which envisioned machines that would think better and faster than human beings, eventually solving problems without any human intervention.
More recently, IBM has developed what it refers to as Cognitive Computing, which aims instead for a “natural interaction” between computers and people. Making use of a new “neurosynaptic chip” and a computing architecture that brings together memory, processing and two-way communication with people (using natural language and visualization techniques), IBM’s cognitive computing system Watson made its debut in 2011.
Profit is a great motivator in the business world, but it is not always the most effective source of environmental progress.
Competing on the TV show Jeopardy!, Watson beat the game’s most accomplished players without any access to data outside its own internal memory. To accomplish this feat, IBM data scientists spent years not only developing the ways Watson ingests, stores and processes huge amounts of varied data, but also feeding the system data from virtually every field of knowledge that Jeopardy! questions might focus on. On game day, Watson had to figure out what was being asked (not always an easy task on Jeopardy!); generate thousands of possible answers; assemble evidence to evaluate and establish a confidence level for each of these possibilities, and then analyze the current situation in the game to gauge whether or not to risk pressing the buzzer to offer its best answer — all in about three seconds.
Watson won, and has since moved on to more serious pursuits. The system is now helping doctors at Memorial Sloan Kettering Cancer Center in New York diagnose patients and decide on the best treatment options. In the future, Watson’s successors may help humans run cities, manage their investments, improve retail sales and accelerate advanced research. Thanks to a recent agreement with Apple, Watson may even someday replace Siri, the iPhone app that understands spoken language and tries to answer users’ questions by accessing the web. Watson would presumably provide better answers without having to use the Internet and, in the process, would greatly expand its own knowledge base.
Optimizing Business, Environmental Performance
Big Data is also likely to help the world solve some of its most intractable environmental problems. Other articles in this report explore the ways in which Big Data is helping to meet the planet’s growing demand for energy and food as the world population reaches near nine billion and climate change threatens drastic reductions in resources.
Another powerful use of Big Data is its ability to help assess environmental risks, both in real time and in the future. Charles Iceland, senior associate of the markets and enterprise program at The World Resources Institute (WRI) told IGEL conference attendees about Aqueduct, WRI’s interactive water-risk mapping tool, which calculates overall water risk anywhere on the planet, based on a variety of risk factors related to the quantity of water, its quality, and changing regulatory and reputational issues in the region. Users can access the tool without charge online, choosing which factors they want to focus on and how they are to be weighted (based on the industry involved). They can zoom in to look at small areas or zoom out to take in whole continents.
Aqueduct can also show how water risks change over time, providing forecasts for 2025 and 2095, based on three distinct scenarios. Color-coded results are typically generated in a matter of seconds, enabling corporations concerned about water use to focus conservation efforts where they are most needed, and to site future operations where water is most available.
IBM’s hyper-local weather forecasting system, Deep Thunder, is offering a handful of U.S. utility companies a different kind of risk assessment. Using Deep Thunder, these utilities can predict where highly localized weather events are most likely to cause outages, allowing the company to position crews where and when they are most needed to restore service. This ability reduces the time that customers are without power, decreases the company’s costs and optimizes the use of the energy being produced.
Optimization of resources is a hallmark of Big Data’s contribution to the triple bottom line. David Parker, vice president of Big Data for SAP offered several examples at the IGEL conference. Pirelli, the Italian tire company, works with SAP’s big-data management system, HANA, to optimize inventory using second-by-second data generated by sensors in its tires worldwide. The result: less waste, more profits and fewer tires heading to landfills.
Alliander, the large Dutch utility, uses HANA to keep the grid running at peak efficiency, increasing profits and reducing environmental impact. Jeroen Scheer, manager of task force transition at the company, says that it used to take 10 weeks for the company to optimize the grid, a task it completed once a year. “Now we can do it every month and it only takes three days,” Scheer notes.
Even incremental improvements in efficiency can add up to huge savings. In his closing keynote address at the IGEL conference, Rogers spoke about the potential of Big Data to optimize performance throughout the business world. Just a 1% improvement in efficiency in five of today’s major industries — aviation, health care, power, rail, and oil and gas — could save $276 billion over the next 15 years, said Rogers. That’s a lot more profit for the companies involved and a lot less damage to the environment.
More Effective Regulation
Profit is a great motivator in the business world, but it is not always the most effective source of environmental progress. Regulation is sometimes needed to advance sustainability. Too often, though, regulation imposes burdens on businesses without benefiting the environment as intended. The problem, some say, is that legislators and regulators use an ineffective command and control approach to regulating business.
According to Cary Coglianese, a Penn law professor and director of the law school’s Penn Program on Regulation, Big Data offers an alternative. By using Big Data techniques to integrate and disseminate previously protected information, governments can “unleash these regulatory shackles” and focus companies on results rather than rules. The firms are free to experiment and find the most efficient means of achieving the desired results, while the government can use improved sensor technology and real-time reporting of environmental quality data to monitor their progress.
Just a 1% improvement in efficiency in five of today’s major industries — aviation, health care, power, rail, and oil and gas — could save $276 billion over the next 15 years.
Coglianese points to the 1990 Clean Air Act amendments as an early example of how data can be used to craft a more flexible approach to environmental regulation. Those amendments authorized what turned out to be a very effective emissions trading regime for dealing with acid rain, says Coglianese. “And that was made possible largely by the development of continuous-emissions monitoring technology that could be deployed at large utility facilities.”
Public release of information can even help improve the data itself. Coglianese notes that when the Toxic Release Inventory (TRI) regulation was first established in 1984 after the Bhopal gas leak accident in India, the data released by companies was not very good. But once firms saw what happened when the media and others discovered and exposed flaws in their data, they quickly realized how important it was to get their facts straight. Today, TRI is generally considered one of the most effective environmental regulations ever enacted.
The next Industrial Revolution has begun and is already helping to advance sustainability worldwide. It is still early days, but if Big Data can power future progress as effectively as steam and electricity fueled the first Industrial Revolution, the 21st century may turn out far better than many in the environmental community thought possible.