
In the quest for growth, competitive advantage and efficiencies, companies are refining the way they gather business intelligence from data they have on customers and the markets in which they transact. The quality of this business intelligence depends on the following: (a) clearly defining the business challenge at hand, (b) ensuring that they collect the right data with the appropriate governance regimes, (c) extracting the ‘smart data’ subsets by eliminating ‘noise’ or irrelevant data, and (d) conducting analytics with the right metrics and methodologies.
This white paper looks at how organizations capture smart data and conduct analytics to yield the desired insights. The paper is produced by Knowledge at Wharton and sponsored by WNS Global Services, a NYSE-listed business process management company headquartered in India that provides analytics products and services to global brands and corporations.
Companies have access to a constant stream of data, both batch and real time, from internal operations such as their supply chains, or external sources such as customers or competitors in the market. Such data, or ‘Big Data,’ is captured through a variety of sources such as customer surveys or web traffic logs, energy smart meters or social media interactions, and enterprise resource planning systems. “Not only are we drowning in data, but it’s so many different kinds of data,” says Wharton marketing professor Peter Fader.
“Big data should be thought of as a process — how to get to new insights, how to turn them into action, resulting in business value,” according to a paper¹ by research services firm Gartner. “Traditional data warehouses have always focused on building data models, data integration processes and analytical applications, mostly for others to use,” it noted, adding “The big data process is more focused on working with data itself.¹”
The term ‘smart data’ typically refers to those parts of Big Data that are relevant for analytics, and the resulting refined data sets. Smart data is usually a subset of Big Data, but it could also include data that is not being captured. Smart data is also typically stored in digital formats that lend themselves more easily to analytics than analog formats.
Big data should be thought of as a process – how to get to new insights, how to turn them into action, resulting in business value.¹— Gartner
“Analytics is industry-agnostic” and has extended beyond the early adopters in retail, travel and entertainment industries, says Eric Bradlow, Wharton professor of marketing, statistics and education, who is also co-director of the Wharton Customer Analytics Initiative. He cites a health care project he is working on, which is about predictive analytics for health outcomes. “With such analytics, we can prevent you from getting sick, and that is what is going to drive down health care costs.”
Others who have found good uses for smart data include insurance companies and credit card firms, says Bradlow. “They are noticing that the content people post online on social media is very predictive of riskiness behavior, so it’s very predictive of credit scores.” Those companies are appending such insights from social media to their classic economic variables such as credit scores to predict outcomes more accurately.
Three Stages of Analytics
Any organization embarking on its smart-data journey would have to progress through three levels of maturity, according to Akhilesh Ayer, executive vice president and head of research and analytics at WNS.
- Basic data analytics: Here, organizations could get a reasonably good first glimpse with fairly simple processes. For instance, previously a consumer packaged goods company would typically track customer usage patterns and attitudes, point-of-sale data, household survey data and shipment data. Now, they could harmonize all that with data from social networks, mobile tracking systems and so forth. “This is basic stuff, not sophisticated analytics, and it could generate up to 200 metrics,” says Ayer. “But with these alone, they have gotten so much smarter about their data to get a 360-degree view of a brand or a category or a customer. More and more companies are realizing the power of doing this at the first stage.”
- Advanced analytics: Here, sophisticated analytics models are used, going beyond the conventional regression methods that are often not very predictable, says Ayer. Oftentimes, regression methods show correlation but not causality. Companies also invest in applications to automate basic analytics models to reduce processing times and improve accuracy.
- Cognitive or intelligent analytics: Insights gained from advanced analytics lead to new-age tools such as artificial intelligence, machine learning and smart data discovery. Artificial intelligence/machine learning tools are the foundational elements of a cognitive organization, and they enable an organization-wide approach to analytics. The algorithms that such tools use iteratively learn from data and find hidden insights without being explicitly instructed where to look. For example, machine learning could help a retailer run a personalized campaign with offerings tailored for specific individuals, and on a mass scale. In such exercises, a retailer would do rapid experimentation by testing and retesting a campaign offering, feed the results in real time to its personalization model, thereby constantly refining it for each individual customer. “Ideally, every person is a market segment,” Ayer says.
Extracting Smart Data
The process of extracting smart data begins with identifying the end-issues that need to be addressed. “These could be outcomes like cost savings, efficient decision making, the ability to serve customers better, or improve customer engagement,” says Ayer. Asking the right questions is critical, adds Fader. “The big, fundamental question is how valuable will this customer be in the future?”
The term ‘smart data’ typically refers to those parts of Big Data that are relevant for analytics and the resulting refined data sets.
Fader cautions against relying solely on one narrow set of data, such as social networking data, however rich that might be in detail. “You may end up both over-emphasizing its importance and coming up with relationships that might not even be valid,” he says. “They might capture chance variations in a data set, but might not necessarily be enduring, ongoing, robust effects.”
Asking the right questions guides organizations to the right data, says Fader, who offers the example of mobile gaming company Electronic Arts. He notes that the company has “incredible telemetry data” and it knows who is playing which game and when, what weapons they are using, what worlds they are in, and with whom they are playing. Instead of yielding to the temptation of using all that data, it looks at “simpler behaviors – which game did you buy when, when did you play, did you acquire any add-ons as you played the game,” he adds.
Essentially, Electronic Arts wants to zero in on customer lifetime value, and builds its analytics model to determine the future valuation for each customer, says Fader. “Only after that do they go back to analyzing their basic telemetry data to understand how customers differ from each other in terms of game characteristics.” He says such exercises also help answer questions like how higher-value customers are different from lower-value customers in terms of how they play the game, what weapons they buy, when they play the game and so on; and provide insights useful in new game development.
“The big, fundamental question is how valuable will this customer be in the future?”–Peter Fader
Well-defined questions for the analytics exercise brings clarity on where the relevant data exists and any quality issues they may have, the selection of analytics models, and even the contours of what is feasible and what is not. Ayer cites the case of a large European retailer, which has determined the five questions it wants answers for, but hasn’t yet identified the sources for all the data it needs. But it does know that it could find answers to two questions immediately, the third will need six months of work and the remaining two could be answered only after one year, he says.
The immediate preparatory stage is to conduct an “exploratory data analysis” on the raw data, says Ayer. “That helps eliminate irrelevant data, or ‘noise,’ and distill out the relevant data to build the model for their experiment.” For example, a retailer that wants to personalize customer offerings would need customer names. But that same data on customer names may be irrelevant for a health care company that is tracking patients’ smoking patterns to develop cancer treatments or an insurance company that wants to design policies suitable for smokers, he adds.
“Too often, people are letting the data drive the analytics,” says Fader. “You have to have a plan before you execute.” Indeed, at times, the data that an organization seeks may not be readily available. He underlines the problems that arise in using a model that is driven by the data, as opposed to being thoughtful and looking for the right data to find answers. “We’ll often get research outcomes that are not nearly as good, predictions that aren’t as accurate, and implications that aren’t as robust and enduring as compared to the method that begins with looking for the right data,” he says.
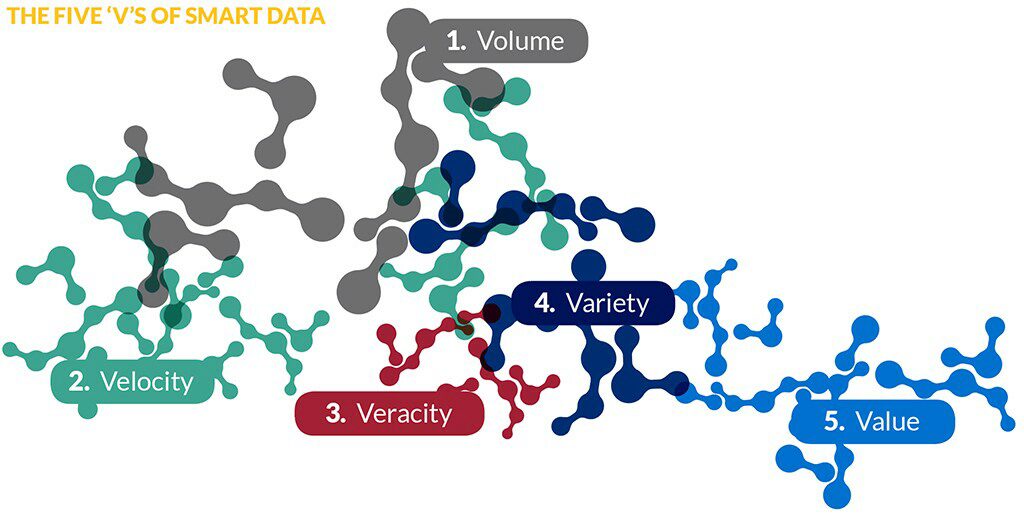
The Five ‘V’s of Smart Data
According to Ayer, smart data revolves around the five aspects of volume, velocity, veracity, variety and value. He offers an example in health care. At a hospital, volume is important in the case of patient-level data on medical history, physical history and genetic family traits. Similarly, clinical data related to laboratory tests and physician’s visits or administrative data on payments are increasingly becoming voluminous. Therefore, volume is a critical component in the health care industry.
Velocity refers to the need to digest and conduct real time analysis of the data that is being generated at a rapidly increasing pace owing to technological advancements. For example, in health care, velocity would be important if patient data relating to MRI or CT scans, or weight changes, are captured and transmitted in real time over cloud platforms to others involved in a treatment regimen such as a medical device manufacturer, a pharmaceutical company or a diagnostic center.
Veracity is critical for such treatment-related data, especially if it is sourced from systems at several organizations in the health care ecosystem. Pharmaceutical companies may find themselves grappling with a variety of data feeds, such as from their marketing channels, social networks, surveys, physician networks and medical or scientific journals. Here, standardization of information would play a critical role.
Value is a critical aspect as it’s important to ensure that the right insights are generated from the data and they lead to measurable improvements in patient outcomes.
Emergence of Newer Metrics
After articulating the business challenge, framing the right questions and finding the right data, the next challenge is to apply the right metrics and methodologies for analytics. Here, data mining and machine learning have exploded in adoption over the last decade, says Bradlow. Driving that is partly the availability of the requisite software for analytics, and the ability to do that on a large scale, he says. “These new methods allow us to uncover more subtle and more sophisticated relationships.”
In past decades, regression methods have driven most of the analyses, but with shortcomings that newer techniques are trying to address, says Bradlow. Those new techniques, which go by the names of “decision trees” and “random forests,” could pick up insights that regression might not pick up, he adds.
Asking the right questions guides organizations to the right data.
Bradlow offers the example of a maker of luxury products that might separately find that older people are more likely to buy its product, and that wealthier people are more likely to buy its product. “What if there is an interaction of those two things – and older, wealthier people are more likely to buy my product?” he asks. “You might be able to pick that up through a regression method, but you might not if things don’t increase gradually in a linear fashion. Instead, suppose it’s only when someone turns 60 or it’s only when someone achieves a million dollars in wealth that they are likely to buy the luxury product. In order to discover more complex relationships among variables, more sophisticated methods are called for, he adds.
Identifying the right metrics is also important in teasing out smart data, says Bradlow. For example, tracking the time consumers spend on a website may be a “false metric” because that website might be poorly designed, making navigation time consuming, he explains. Also, he notes that the revenue streams at most businesses are “irregular, not subscription-oriented and have non-contractual settings.”
According to Bradlow, the classic metrics for measuring customer lifetime value are R, F and M, or recency – how recently did they buy; frequency – how frequently did they buy; and monetary value – when they buy, how much do they spend? “But they leave out one specific aspect of customer behavior which I call clumpiness,” he says, explaining that it represents a refinement in metrics. “Clumpiness refers to people buying in hyperactive states and they get cold for a while, and repeat that pattern. Turns out that people who buy in a clumpy fashion have a higher customer lifetime value. It is more predictive of customer lifetime value than frequency and monetary value.”
“Analytics is industry-agnostic and has extended beyond the early adopter in retail, travel and entertainment industries.”–Eric Bradlow
Meanwhile, Ayer observes that “hundreds of startups” have sprung up in the field of artificial intelligence, offering advancements in smart data and customer analytics. For example, AI is used by airlines, where automated call centers respond to customer requests for flight information. “The machine at the other end looks into a knowledge base and tries to give a response,” explains Ayer. “The artificial intelligence part of that is to decode your voice into text in its algorithm, match it with pre-set questions that are built into its model, pull up the closest match, convert that text back into voice and relay it back to you. Further, advancements in AI are enabling interactive conversations between bots and end customers to satisfy customer needs wherein even the pre-set questions are not required.”
Prerequisites for Smart Data Analytics
Ayer lays out these guideposts for organizations to have a cogent and holistic approach to their data strategies:
- Collect big data in a manner that is structured, easily accessible, scalable and easy to process and leverage across dimensions and across time.
- Build an efficient basic data architecture with well-defined data catalogs, data governance protocols that specify globally standardized processes to collect and store data and security encryption mechanisms.
- Enlist the services of data governance teams and data custodians.
- Set up analytics and data organizations, and vest them with the requisite powers.
- Democratizing data may be required, which is making it accessible enterprise-wide or to the business units that need them.
- Ensure coordination, collaboration and sharing of data and analytics enterprise-wide as required.
Best Practices for Analytics
Bradlow offers some guideposts for analytics practitioners:
- The empirical: If you want to know the answer to something, collect data and make sure it is good data. Also, use all the data sources you can.
- Experiment: While fancy statistical models are valuable, if you want to know the answer to something, you should at least run a simple randomized experiment.
- Theory is critical: Don’t forget that theory plays an important role. It helps answer questions such as where do you look for answers in data, where do hypotheses come from and how do you test them.
In sum, in order to truly leverage smart data, organizations must begin with the right philosophical underpinnings in their data strategies, build the data architecture with the requisite democratization and create an internal culture of sharing and collaboration. Thus prepped for their smart-data journey, they must (a) define their problem accurately; (b) look for the data that could provide the answers instead of being data-led; (c) use new analytics techniques that go beyond conventional regression methods; and (d) never swerve away from the empirical, experimentation and theory.